Mostrando entradas con la etiqueta pachube. Mostrar todas las entradas

lunes, 27 de febrero de 2012

Sending temperature data to pachube using pic based microcontroller


Abstract

In my previous article I described a way to send data to a feed created on pachube to store data that came from a temperature sensor of my laptop. The article was intended to show the procedure that has to be followed to send data to pachube's feed.

In this article I am going to show you how to obtain data from a lm35 (temperature) sensor attached to a arduino like board (pinguino), send them to pachube's feed and then visualize the data using Komposer.

Sending temperature data to pachube using pic based microcontroller

The first thing that we have to understand is the whole picture. The following image shows you how is  the relationship among the different components.


The components required are:

1x LM35 Precision Centigrade Temperature Sensor
1x Pic 2550 based Pinguino (arduino like board) or arduino board(1)
1x PC using linux (I use Ubuntu 11.10) with python installed

The above image shows the LM35 sensor attached to the microcontroller which is responsible for reading the analog pin where the sensor is attached, calculates an average of the values red and converts them to centigrades, then send this value through the serial port to the PC.

The PC will receive the values through the serial port where a python script is in charge for reading each value of temperature and send it to pachube's feed (previously created on pachube's web site).

A third component is related to the way we can access the data in a form of a charts such that we can easily see temperatures trends over an hour, a day or a week. This component is a simple static web page created with komposer.

Firt things first

The first thing we have to solve is reading the sensor from the microcontroller. To do this we have to have the components and attach them using a protoboard.


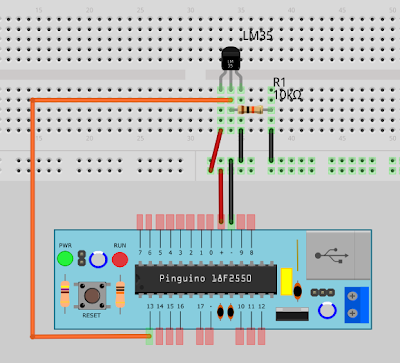
I have used fritzing to do this model where you can see the lm35 attached to the pin13 of our pinguino. The pin 13 is analog so it is suitable to read different voltages (0-5V). The LM35 is very simple to connect and read. It has only 3 pins (VCC, VOUT, GND). This link has a very good tutorial of how to read and convert the Vout value so the reading sent to the serial port is easily read in its final scale.

For this schematic we have used a pull-up 10K resistor due to the fact that pinguino 2550 lacks of these internally. VCC and GND comes directly from the pinguino VCC and GND.

With this all set on our protoboard it is time to load the code on the micro using the 32 bit Pinguino's IDE.


byte pinTemp=14;


void setup()
{
   pinMode(pinTemp,INPUT);
}


float temp(byte pin, int n, int milis)
{
  int i=0;
  int valorPin=0;
  //read cycle defined by n iterations waiting (millis) milliseconds
  for (i=0; i<n; i++)
  {
    valorPin= valorPin + analogRead(pin);
    delay(milis);
  }
  //return the average value coverted to celcius
  return (5.0 * (valorPin/n) * 100.0)/1024.0;  
}


void loop()
{
   CDC.printf("%d\n", (int)temp(pinTemp,100,600));
}

A little explanation of the code:

1) On the setup() block we initialize the pin as an analog input.
2) On the loop() block we print the result to the serial port using CDC and the custom temp() function.
3) On the temp() function we calculate the average of 100 values red with analogRead(), each one executed every 600 milliseconds, then return the value converted to centigrades.

With 100 reads each one executed every 600 millis we will obtain a temperature value every minute or so. This value is sent to the serial port (/dev/ttyACM0) and can be red with the following script using python.

#!/usr/bin/python

"""
tempLM35.py
"""
import os.path
from datetime import datetime
import serial
import signal
import sys
import subprocess
import eeml

pachubeURL="/v2/feeds/47024.xml"
pachubeKEY="bfr0eqPG26CdsRgwTOrgIPZV86DRGJr1q9Ept4ZjaJ8"

#Verificacion del parametro indicando el puerto serial /dev/ttyXXX
if len(sys.argv) > 1:
   if os.path.exists(sys.argv[1]):
      puerto = sys.argv[1]
   else:
      print "El puerto especificado %s no existe!" % (sys.argv[1])
      sys.exit(1)
else:
   print "uso: showSerial.py /dev/ttyXXXX"
   sys.exit()

#Apertura puerto serial
try:
   ser = serial.Serial(puerto, 9600)
except (serial.ValueError, serial.SerialException):
   print "\n::Error::\n Puerto=%s" % (puerto)
   sys.exit(2)

#Funcion para el catch del ^C
def signal_handler(signal, frame):
   print ' Saliendo...'
   ser.close()
   sys.exit(0)

signal.signal(signal.SIGINT, signal_handler)

pachube = eeml.Pachube(pachubeURL,pachubeKEY)
#while 1:
try:
   result=ser.readline()
except serial.SerialException:
   print "\n::Error::\n Puerto=%s" % (puerto)
   sys.exit(2)

result=result.replace("\n","")
pachube.update([eeml.Data(0, result, unit=eeml.Celsius())])
pachube.put()
print "("+str(datetime.now())+") --> "+result+" Celsius"

At the end of this code we use the eeml library to update and send one value to the feed 47024 referred with pachubeURL variable using our unique key for authentication (pachubeKEY).

This script have to be executed each time we decide to obtain a value from the serial port and send it to pachube's feed. Linux give us a tool called cron. Updating the crontab to execute the script every minute allows us to send the data at the same rate of the microcontroller.

* * * * * /home/ydirgan/SCRIPTS/pachube/tempLM35.py /dev/ttyACM0 >>/home/ydirgan/SCRIPTS/pachube/tempLM35.out 2>&1

The last line of the python script prints out the following formatted line (ie):

(2012-02-27 12:18:19.740213) --> 28 Celsius
(2012-02-27 12:19:10.317034) --> 29 Celsius
(2012-02-27 12:20:51.447645) --> 28 Celsius
(2012-02-27 12:21:41.929904) --> 28 Celsius

As you can notice on the cron entry above, the script is executed redirecting the referred output to tempLM35.out which will contain the historical values red from the sensor. This file can be used to create a chart on (i.e.) a libreoffice spreadsheet utility. Instead, we use pachube to store that data and let it to create the charts.

Finally using the same technique from our last article (using komposer) we can show the charts in one page and using labels to identify the charts and to make easier the interpretation.

Using an auto-load plugin on the browser you can keep up to date this page to see what is going on with the temperature of the room.

follow us on twitterG+ or Facebook
Read More......

jueves, 16 de febrero de 2012

Internet of Things: Using Komposer to visualize Pachube' s charts

In my previous article I described the way to send data to pachube and showed a little example of how to show the charts alternatively.

The way Pachube shows charts can be modified to our requirements using Komposer. The video is self explanatory... take a look!

VIDEO: How to create a litlle Web Page to visualize Pachube's Charts Read More......

domingo, 5 de febrero de 2012

Internet of things: How to send data to Pachube


Abstract

Last article was dedicated to describe Pachube, today I am going to show you how to send data from a PC to datastreams created on Pachube's Web Site. The information depicted here will give you a general idea of the procedures needed to send information to a datastream from a sensor inside a laptop (i.e. temperature sensor) , and in the next article we will use this background to obtain values from a temperature sensor attached to an arduino platform, to have a chart updated in real time at pachube.

This way we can have a database of any kind of values obtained from any source of data on the internet, totally free and 24 hours uptime.

VIDEO: How to send data to a feed on pachube

So, let get started.

How to send data to patchube

A feed is a database that we can create on www.pachube.com, after create an account. This service is free and can be used anywhere.

A quickstart of pachube can be accessed here, where there are instructions to automatically get statistical information of out twitter.. give it a try!

VIDEO: How to send data to a feed on pachube

Once we have created a feed, we are ready to send information to our database.

There are several ways to do it. I have chosen the python method due to it's versatility and because python is multi-platform.

For our experiment I have decided to read the temperature of my laptop based on Ubuntu. This can be accomplished using the sensors command. Using a simple filter we can isolate the temperature value from the output of sensors:


acpitz-virtual-0

Adapter: Virtual device
temp1:        +54.0°C  (crit = +100.0°C)
temp2:        +54.0°C  (crit = +100.0°C)

I have used the follwing command to isolate the temperature  value of one of the cores of my laptop Dell.

sensors | grep temp1 | cut -d: -f2 | awk '{print $1}' | sed s/+//g | sed s/"°C"//g

... and the result after I execute the above command is:

54.0

Which is the temperature that I want to send and have a chart of it.

After we are confident that we can obtain a consistent value every time we ask for it, it is time to create the python script to get that value and send it to our database on pachube. We can send a value every 30 seconds or every minute, or using the interval that is suitable for our application. This interval is going to be programmed using the automated command execution facility on linux called cron.

The code is very simple and is written below:

1 #!/usr/bin/python
2 import subprocess
3 import eeml

4 pachubeURL="/v2/feeds/47024.xml"
5 pachubeKEY="bfr0eqPG26CdsRgwTOrgIPZV86DRGJr1q9Ept4ZjaJ8"

6 proceso = subprocess.Popen("/home/ydirgan/SCRIPTS/pachube/tempRead.ksh",stdout=subprocess.PIPE,stderr=subprocess.PIPE)

7 temperatura, errores = proceso.communicate()

8 pachube = eeml.Pachube(pachubeURL,pachubeKEY)
9 pachube.update([eeml.Data(0, temperatura, unit=eeml.Celsius())])

10 pachube.put()

Lines 4 and 5 defines the feed and our unique key needed to authenticate and access the web service.

In line 6 we execute  tempRead.ksh that is a simple script thet execute the filter shown above. 

#!/usr/bin/ksh
sensors | grep temp1 | cut -d: -f2 | awk '{print $1}' | sed s/+//g | sed s/"°C"//g

Line 7 reads the output of the script tempRead.ksh which is a value that will be packed in line 9 using eeml. In our case the UID of our feed is 0, the value is in temperatura variable and the units are in Celsius.

Finally we send the value using the put method in line 10.

This simple script can be manipulated and modified to send more than one value if we have more than one feed. Every feed is enumerated when we create it (see video). An example of this might be give the following line as parameter of the update() method:

[eeml.Data(0, temperatura, unit=eeml.Celsius()), eeml.Data(1, cpuUser, unit=eeml.none())]

Using this simple procedure we can update our feeds to have our sensors values up to date on the internet publicly or in a private fashion.
In the next article I am going to show you how to get values from sensors attached to arduino and send them to our feeds.


Read More......

domingo, 29 de enero de 2012

Internet of things

Abstract

In this chapter we will describe pachube. This is a web based tool for showing graphics about values red from devices connected to internet.

This is intended to be short and concise, which will allows to understand the next entry of this blog, when we connect our arduino to this tool for track a temperature sensor.

The information described here was extracted from their URL: www.pachube.com

What is Pachube anyway?

Pachube is a realtime data infrastructure platform for the Internet of Things , managing millions of datapoints per day from thousands of individuals, organisations & companies around the world. Pachube's powerful and scalable infrastructure enables you to build 'Internet of Things' products and services, and store, share & discover realtime sensor, energy and environment data from objects, devices & buildings around the world.

What allows Pachube?

Manage realtime sensor & environment data :
Pachube is a data brokerage platform for the internet of things , managing millions of datapoints per day from thousands of individuals, organisations & companies around the world. Convenient, secure & economical, Pachube stores, converts & serves data in multiple data formats , which makes it interoperable with both established web protocols & existing construction industry standards. All feeds include contextual metadata (timestamps, geolocation, units, tags) that actually make datastreams valuable.

Graph, monitor & control remote environments :
Embed realtime graphs & widgets in your own website. Analyse & process historical data pulled from any public Pachube feed. Send realtime alerts from any datastream to control your own scripts, devices & environments. Out-of-the-box configurable tools include a zoomable graph , a mapping/tracking widget , anaugmented reality viewer , SMS alerts & apps for various smartphones . As soon as something is plugged into Pachube, you're ready to monitor & control it.

Build mobile & web apps that create value :
With a rapid development cycle & dozens of code examples & libraries, Pachube's simple yet sophisticated'physical-to-virtual' API makes it quick & easy to build applications that add value to networked objects & environments. That's because real value-creation comes from the applications that are built on top of sensor systems. Pachube handles the scalability & high-availability required for complex data management, so that you are empowered to develop applications that make decision-making more sophisticated.

Share data & create communities :
Pachube is built to encourage open ecosystems. Connect electricity meters , weather stations , building management systems , air quality monitors , biosensors , geiger counters — build communities around devices & data collection. While privacy options will soon be available, Pachube's unique openness promotes growth: most hardware & software libraries & real world applications are being created by its community!

Pachube's website is a little like YouTube, except that, rather than sharing videos , it enables people to monitor and share real time environmental data from sensors that are connected to the internet. Pachube acts between environments, able both to capture input data (from remote sensors) and serve output data (to remote actuators). Connections can be made between any two environments, facilitating even spontaneous or previously unplanned connections. Apart from being used in physical environments, it also enables people to embed this data in web-pages, in effect to "blog" sensor data. Through the extensive use of metadata, Pachube adds value to physical interconnectivity: it's not just about datastreams, but about the environments that make up the datastreams.


Pachube makes it simple to build applications, products and services that bridge physical and virtual worlds. With a rapid development cycle (it can take just one line of code to start prototyping ), and a sophisticated development path (working with both web-protocols and data formats that are interoperable with construction industry formats) people have used Pachube to build sensor-logging systems, remote monitoring apps, integrate building management systems, develop geo-tracking systems, create mashups and networked objects and a whole host of other things. For more on what you might do see What can I use Pachube for? .

Apart from CSV and JSON , Pachube also makes use of Extended Environments Markup Language (EEML) , which extends the construction industry protocol IFC. An extensive RESTful API makes it possible to both serve and request data in all formats. Data can be pushed to Pachube using an HTTP PUT request (especially useful for those operating behind firewalls or with non-static URLs) or Pachube can pull data from devices that are able to serve.

There are extensive tutorials and software and hardware libraries and examples available for all sorts of platforms.

Relevant URLs:

- http://www.pachube.com/ (main website)
- http://www.economist.com/node/17388392 "The Economist: Special Report on Smart Systems - Augmented Business"
- http://www.ugotrade.com/2009/01/28/pachube-patching-the-planet-interview... (interview with Pachube's founder)
- http://eeml.org/ (Extended Environments Markup Language)
- http://api.pachube.com/ (technical documentation) Read More......

domingo, 15 de enero de 2012

Comunicación con Arduino usando un cliente de mensajería

Abstract

(go to English Version)

En el artículo anterior vimos la teoría básica de como comunicarnos con el microcontrolador a través del puerto serial de nuestro PC. ref: Comunicación con microcontroladores tipo Arduino

En este artículo veremos lo básico para hacer que el micro responda a órdenes enviadas a través de un cliente de mensajería, correo electrónico, pachube o twitter.

Downloads: serialLed.pdeled1log.pyled-1.kshexternal
VIDEO: Paso a Paso

Sesión Interactiva: 
Agregar contacto vía messenger (msn) ydirganbot@hotmail.com y Verificar el broadcast del circuito montado para ver los leds AQUI.

Intrucción

Ya hemos visto como enviar o recibir información hacia y desde el micro utilizando el puerto serial. El paso a seguir es utilizar el micro para hacerlo reaccionar a órdenes enviadas a través de nuestro PC o analizar y reaccionar a información recibida del micro.

En una primera instancia estudiaremos la forma de hacer reaccionar al micro de acuerdo a las órdenes que le podamos enviar por el puerto serial. Inicialmente hicimos enviar directamente las órdenes a través del puerto utilizando la modalidad directa, pero la idea de fondo es poder utilizar alguna interfaz que nos haga el trabajo más sencillo.

Por ejemplo, trabajar con algún tipo de interfaz de comunicación, como un cliente de chat, correo electrónico, pachube o twitter, por nombrar los cuatro que vamos a explorar en este y los próximos 3 artículos.

Comunicación con el micro a través de messenger

Buscando extensamente en la Web por software gratuito para utilizar algún cliente de chat me encontré con centerIM. Esta aplicación es un cliente muy ligero de chat, el cual puede configurarse con una variedad de cuentas públicas como messenger, yahoo, etc.

REF1: CenterIM home
REF2: centerIM Installation

En la referencia anterior puede accederse la página del producto así como un muy buen artículo de como instalarlo en ubuntu.

La documentación que encuentran en la referencia 1 es muy amplia y con ella pueden configurar inicialmente el paquete. En mi caso yo lo configure con una cuenta que cree especialmente para este experimento.

Siendo un cliente de chat funciona como cualquier otro cliente de mensajería, pero con un adicional que encaja muy bien para nuestro objetivo. El centerIM permite programar scripts para ejecutar tareas de acuerdo al contenido de los mensajes entrantes. Con esta capacidad se pueden programar diferentes comportamientos de forma de enviar vía serial comandos al microcontrolador. Esto permite comunicarnos desde el messenger con el computador de la casa para por ejemplo ejecutar alguna tarea de activación de alarma, encender luces o apagarlas, etc.

Esta configuración se debe hacer a través de un script que debe copiarse en $HOME/.centerim y cuyo nombre debe ser external.

El formato del script external es muy simple.


%action         Acción a tomar de acuerdo a las siguientes condiciones

event           msg
# Reacciona solo a mensajes
proto           msn
# Solamente  para el protocolo messenger
status          online
# responde solo si el status de la cuenta es online
options         stdin stdout
# .. los comandos externos (abajo) leen de
# stdin, luego su salida stdout es enviada como una respuesta 
# a un usuario remoto
%exec
msg=`cat`
echo $(/home/ydirgan/.centerim/commTest.ksh "$msg")

%exec redirecciona el mensaje a un simple script que solo devuelve el mensaje por la misma vía.

#commTest.ksh
#!/usr/bin/ksh
msg=`echo $1 | tr a-z A-Z`;
printf "arduino-1 orden rebibida: $msg";

Al momento de recibir el mensaje, centerIM redirecciona la salida al script commTest.ksh, este recibe el mismo como un parámetro el cual lo convertimos en mayúsculas y lo devolvemos a centerIM por el stdout.

A partir de este simple ejemplo podemos modelar un pequeño script para encender/apagar 4 leds conectados a los pines digitales 0..3 de nuestro teensy.

A continuación los pasos que deberemos seguir:
  1. Crear un script ara el micro que responda a las órdenes enviadas vía serial
  2. Crear un script de logging del puerto serial
  3. Crear el script que es llamado desde "external", el cual contiene la lógica de ejecución
  4. Crear el script "external" para centerIM
(1) Script para el Microcontrolador

Este script responde a los comandos recibidos por el puerto serial del teensy (micro como el arduino).

El script enciende o apaga un led en el pin n (1<=n<=4). Espera por un caracter que esté disponible en el puerto serial. 

entrada serial = 1: enciende el led 1
entrada serial = 2: apaga el led 1
entrada serial = 3: enciende el led 2
entrada serial = 4: apaga el led 2
entrada serial = 5: enciende el led 3
entrada serial = 6: apaga el led 3
entrada serial = 7: enciende el led 4
entrada serial = 8: apaga el led 4

Una vez que descarguemos el programa debemos cargarlo en el micro. Una vez cargado podemos probar su comportamiento interactuando directamente conb el puerto, como se puede apreciar en el video al final del artículo.

Download:
 serialLed.pde
(2) Script de logging

Este script tiene como objetivo copiar cada línea de salida de /dev/ttyACM0 a un archivo.log y deberemos ejecutarlo en background para que se mantenga recopilando la salida del puerto.

ydirgan@pragma-systems:~/SCRIPTS/centerIM$ led1log.py /dev/ttyACM0 &
Download: led1log.py
(3) Script con la lógica de ejecución


El tercer script permite ejecutar las secuencias de los comandos que requerimos enviarle al micro. Con las reducidas instrucciones que definimos en el micro podemos desde este script aumentar las funcionalidades.

En este programa podemos encender o apagar leds individuales, pero también podemos encenderlos todos, apagarlos todos, hacer que titilen o que ejecuten una secuencia. Todo esto utilizando las primitivas que hemos programado en el micro.

Además de las instrucciones propias de ejecución, se ha programado una ayuda que puede obtenerse al tipear HELP desde la ventana de chat, y su resultado será:

arduino-1: este es una maquina de estado finita que permite interactuar con un microcontrolador tipo Arduino. Su uso esta destinado solo como ejemplo. El microcontrolador repondera cuando reconozca la orden a ejecutar. Se tienen 4 led, para encender y apagar cada uno de ellos. Los comandos que puedes utilizar son: ledNon, en donde n es el numero del led (1<=N<=4). ledNoff, en donde n es el numero del led (1<=N<=4). ledon, todos los leds se encenderan. ledoff, todos los led se apagaran. tilitar, todos los led titilaran 20 veces. secuencia1, todos los led encienden en secuencia (tipo led chaser) de izquierda a derecha. secuencia2, todos los led encienden en secuencia (tipo led chaser) de derecha a izquierda. help, muestra esta ayuda.

Download: led-1.ksh
(4) Script external para centerIM
Por último el script que ejecuta centerIM cuando le enviamos un mensaje. Este será el que dispare la ejecución del script led-1.ksh, que enviará nuestros comandos vía serial. El micro los procesará y responderá de acuerdo a la secuencia de comandos.


Download: external

Finalmente ejecutamos centerim desde nuestro terminal para activar el robot.

El video para mostrar la secuencia de pasos es el siguiente:


Para probarlo solo habría que agregar a ydirganbot@hotmail.com al messenger. Este responderá cuando esté online.

Read More......